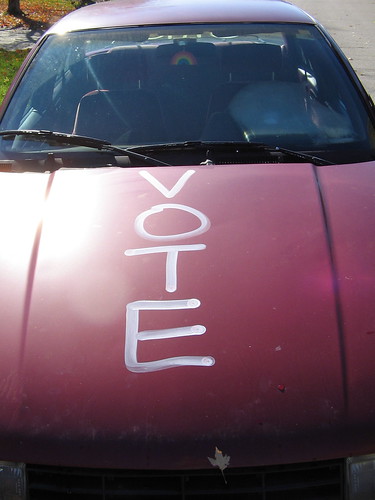
Are you more likely to get in a fatal car accident on election day?
.To the Editor: The results of US presidential elections have large effects on public health by their influence on health policy, the economy, and diverse political decisions. We are unaware of studies testing whether the US presidential elec- toral process itself has a direct effect on public health. We hypothesized that mobilizing approximately 50% to 55% of the population,1 along with US reliance on motor vehicle travel, might result in an increased number of fatal motor vehicle crashes during US presidential elections.
Methods. We analyzed national data from the Fatality Analy- sis Reporting System of fatal crashes in the United States from 1975 to 2006.2 We included all presidential elections since da- tabase inception (from Jimmy Carter in 1976 through George W. Bush in 2004) during the hours of polling (defined as 8:00 AM to 7:59 PM local time). For each election, we also iden- tified the same hours on the Tuesdays immediately before and immediately after as control days for the number of individu- als in fatal crashes at the time, as described previously.3 Con- fidence intervals (CIs) for comparing death counts on elec- tion days and control days were calculated by binomial tests using StatView 5.0 (SAS Institute, Cary, North Carolina).
Results. A total of 3417 individuals were involved in fa- tal crashes during the hours of polling on the 8 election Tues- days and 16 comparison Tuesdays. The modal person was a young adult driving in a southern state (demographic char- acteristics generally stable over time). The 8 election days accounted for 1265 individuals, equivalent to 158 per day or 13 per hour. The 16 control days accounted for 2152 in- dividuals, equivalent to 134 per day or 11 per hour. This yielded a relative risk of 1.18 on election days (95% CI, 1.10- 1.26; Pﰀ.001), equivalent to an absolute increase of 189 individuals over the study interval (95% CI, 104-280).
The net increase in risk was about 24 individuals per elec- tion and was fairly stable across decades of time (FIGURE). The increase in relative risk extended to pedestrians and persisted across different ages, sexes, locations, polling hours, and whether a Democrat or Republican was elected. No differ- ence in risk was observed in separate sensitivity analyses of individuals involved in fatal crashes during the same hours comparing the Monday before the election with control Mon- days (relative risk, 0.97, 95% CI, 0.89-1.06) or comparing the Wednesday after the election with control Wednesdays (relative risk, 1.03; 95% CI, 0.95-1.12).
Comment. The increased risk of fatal motor vehicle crashes on presidential election days exceeds the risk on Super Bowl Sundays.1,3 One explanation is increased traffic, but other factors might contribute. A 4% increase in average speed, for example, could yield an 18% increase in deaths even with no increase in average travel distance.4 Additional factors might include distraction (driver inattention), rerouting (unfamiliar pathways), enforcement (decreased police presence), and demographics (mobilizing unfit drivers).5,6 These potential explanations sug- gest that the increased risk could extend to crashes of lesser se- verity so that the average US presidential election might also result in hundreds of additional individuals with nonfatal injuries.
Source: “Driving Fatalities on US Presidential Election Days” from JAMA, October 1, 2008—Vol 300, No. 13
Related posts:
What should you say to the police when you get pulled over for speeding?
Why is traffic so bad on Mondays?
Does the type of conversation you’re having on your cellphone affect your driving?


